
Why you shouldn’t care what the market is doing
What’s the best response you can give to someone asking you what the market’s doing today?
I don’t know, and I don’t care.
If you’ve ever invested in the share market, chances are you’ve experienced a mix of emotions ranging from euphoria to dread.
We all know that buying something where its price is greater than its value or selling something for less than its value isn’t a good idea. Yet this very thing happens constantly by individual investors trading shares around the world.
So how do you avoid making these mistakes and build your wealth without putting yourself through an emotional rollercoaster?
You need to introduce two key elements: discipline and time.
I’ve heard from many people that they think investing is only for people with large sums of money to start. When some of us are left only with $500 in the bank after a month’s spend, we can be left feeling that this small sum of money can’t do anything for us.
To illustrate just what $500 can do, let’s look at an index tracking fund which allows for small, regular investments from individuals.
These funds have a value-weighted portfolio of the entire stock market’s largest companies – let’s take the ASX300 index, which is simply the largest 300 companies by value in the Australian share market – and you can buy into a portion of this with just your $500.
The first element – discipline – this is required to maintain the psychological key to successful investing – regular savings into your investment no matter what the market is doing.
Left to our own devices many of us would rather spend the $500 left in our bank than voluntarily transfer the money into our investment account. In my experience providing financial advice, those that are successful at this set up an automated transfer lined up with their monthly/fortnightly/weekly pay, such that it takes the control away from them.
So what effect does putting away $500 a month have on your investment? Let’s take a look. Below is the last 10 years (Oct 2008 – Oct 2018) of the value of the ASX300[1].
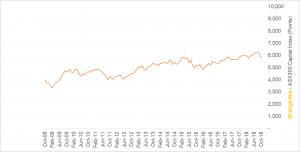
Over the last 10 years, the ASX300 has grown from 3,996.6 points (at Oct 2008) to 5,782.9 (at Aug 2018). The index is tracked in points – think of it as if it’s the average value of these 300 companies.
There were large swings in value throughout the timeline that can cause an investor anxiety.
An important note is that many of these companies pay dividends. If these dividends were re-invested into the stocks they came from, it is possible to see less volatility and better growth. We can see this through the ASX300 Accumulation Index[2]. It tracks the same index but assumes all dividends are reinvested.
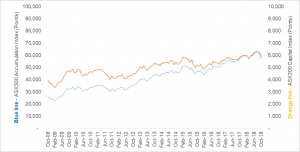
We can see that if we reinvest dividends, the rate of increase in value of the line is greater than just the value of the ASX300. How can we take this a step further for an individual investor?
This is where the second element – time – comes in. The longer the time period, the greater your probability of achieving a successful positive return.
Now let’s look if an investor started investing $500 per month from Oct 2008, all the way until now at Oct 2018, and overlay it over these charts[3].
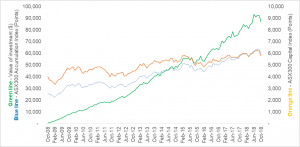
Notice the remarkable difference in stability of the investment compared to the ASX300 & ASX300 Accumulation Index, even though it is invested in these exact assets. Why is this?
Disciplined saving of $500 per month over these 10 years is a form of investing known as dollar cost averaging. It allows you to purchase a portion of the investment at different levels of the value of the investment – meaning buying when the prices are high and buying when the prices are low – you are averaging out the value you are buying at, thereby giving you a much smoother ride than the market is experiencing at any one time.
What does this mean for you? If you are serious about building your wealth, work out how much surplus cash you have left over after each month (or week/fortnight, line it up with your pay) and commit it to a long-term savings plan, into an investment you are comfortable with.
If you had seen the same chart line without knowing you what it was invested into, would you have guessed that it was invested only in Australian shares?
That is the point of this illustration – if you ever get started in a savings plan such as this and someone asks you – how’s the market? Remember your answer: I don’t know, and I don’t care.
Disclaimers and additional notes
Please note that the information in this article does not consider your personal financial circumstances and is general in nature only. You should seek personal advice from an experienced professional adviser before considering if such a strategy may work to meet your goals.
For simplicity, this article does not consider other styles of investment funds such as actively managed hedge funds and other strategies. The intent of the article is to show what disciplined regular investing can do to boost your wealth through an index tracking fund, as this is the simplest form of investment fund one can invest into in consideration of share investment. Other types of investment funds can add or detract from the outcome of this strategy and professional advice should be sought before considering their use.
Please note that this example only uses the domestic Australian share market and the ASX300 index as most of you would be familiar with this, however, the same principle applies in other share markets around the world.
The valuations of the index tracking fund and distributions paid are taken from one of the largest index tracking funds available to retail investors and are real data for the past 10 years.
The calculations in this illustration do not consider taxation of distributions paid on investments, nor the imputation tax credits that may be available on such investments. Since it is assumed in the calculation that all earnings are automatically reinvested, capital gains tax is not relevant unless the investments are sold.
Written by Cody Mackay, Financial Planner on behalf of Oak Financial Planning.
 Cody has extensive qualifications with a Bachelor of Commerce at Monash University, majoring in Finance and Chinese studies.
Cody is a passionate advocate for personal insurance and strives to educate his clients so they can build a strong financial future.
*************************************
Oak Financial Planning Pty Ltd ABN 78 126 751 335, trading as Oak Financial Planning is an Authorised Representative and Credit Representative of AMP Financial Planning Pty Limited, Australian Financial Services Licence and Australian Credit Licence 232706.
This blog article contains information that is general in nature. It does not take into account the objectives, financial situation or needs of any particular person. You need to consider your financial situation and needs before making any decisions based on this information.
If you decide to purchase or vary a financial product, Oak Financial Planning Pty Ltd and other companies within the AMP Group may receive fees and other benefits. The fees will be a dollar amount and/or a percentage of either the premium you pay or the value of your investment. Please contact us if you want more information.
[1] Data extracted from au.investing.com for S&P/ASX300 (AXKO) Historical Data – Monthly October 2008 – October 2018
[2] Data extracted from au.investing.com for S&P/ASX300 Accumulated (AXKOA) Historical Data – Monthly October 2008 – October 2018
[3] ASX300 tracking index fund data via Vanguard Australian Shares Index Fund (VAN0010AU) – retail fund. Data extracted from vanguardinvestments.com.au for historical monthly unit prices and historical distributions. Data uses month end NAV unit price for value calculation. $500 per month is invested at the unit buy price with distributions assumed automatically reinvested at the reinvestment unit price.


